


Maps!
- TerraX Team

- Apr 21, 2023
- 7 min read
Updated: Aug 25, 2023
Hey there, Xplorers!
Maps make the world go round… or, rather, flat! Maps are part of everything we do in CRM, from research to field work to final reporting. You may remember a little bit about how we use Geographic Information Systems software from this post, but today, we’re going to dig a little bit deeper.
As you can imagine, in our world of historical and archaeological research, we rely a lot on maps made in the past — sometimes the pretty distant past. We also layer our own newly collected data on top of old maps to show all kinds of things like shovel tests, archaeological sites, and other important resources. We can use those maps to track the locations of archaeological sites, architectural resources, past surveys, and a million more things. There’s always more stuff to map, and we’re here to map it!
In this post, we’ll be talking about two different kinds of maps — historic topographic maps and historic Sanborn maps. They’re two very different types, but we use both to do the best CRM work we can. You ready? Let’s get into it!
Historic Topographic Maps
Historic topographic maps, which we affectionately call topos, have about 14 billion uses in the CRM field. We use them all day every day — we literally couldn’t do our jobs without them! But what exactly are they?

“Topographic,” according to Dictionary.com, means, “relating to the arrangement of the physical features of the area.” So, it follows that a topo map is a map of the physical features of an area. Topos show us obvious things like lakes, hills, mountains, and rivers, but they also show cities, locations of buildings, and even labels for some important places like cemeteries, churches, parks, and more. Just look at this one, for example. You can see lakes, buildings, green spaces, a railroad, and lines noting changes in elevation.
All that information is super helpful, but here’s the really cool thing about historic topos. Professional cartographers (That’s the fancy name for map-makers.) have been making new editions of topo maps for decades. That means we often have many maps showing the same area from many different years, and we can use those different editions to see how things have changed through time. It’s kind of like those video montages you see on Tiktok or Facebook — you know, the ones with titles like, “Johnny Took a Photo of Himself Every Day From Age 10 to 30.” You watch the images flash by one after another, and you can watch as Johnny grows and changes as he gets older. Historic topos let us do the same thing with cities, landforms, and other cultural features.
As you can probably imagine, historic topos have approximately 17 tons of uses in CRM. For example, sometimes our architectural history department evaluates historic districts to see if they’re eligible for registration on the National Register of Historic Places. We won’t get too in the weeds about what qualifies a district as “eligible” — for now, suffice it to say that the district has to retain enough of its original buildings and “vibe,” if you will, to convey information about the historical time when it was built in order to qualify. By comparing years’ and even decades’ worth of historic topos, we are able to see how the district has grown or shrunk, which buildings have survived the test of time and which haven’t, and whether the overall shape of the district still carries enough of its original characteristics to be on the NRHP.
That’s far from the only use for historic topos, though! We also use them to create helpful visual representations of our work for clients through the magic of GIS. Our GIS specialists will use contemporary GIS information to plot cultural resources, features, buildings, cemeteries, previous surveys, NRHP-registered resources, and more on top of historic topos. That allows us to show our clients where cultural features are, what areas still need to be investigated, how resources intersect with each other, etc. We can convey so much information by combining GPS information and topos in this way, and that ability to create new maps on top of the old ones is, frankly, invaluable to us!
Sanborn Maps

Moving on now, let’s talk about Sanborn maps! Okay, what are Sanborn maps? Thanks for asking! The Sanborn Company made maps of over 12,000 cities in the United States across the nineteenth and twentieth centuries for a very specific purpose — to help fire insurance companies assess the liability of various properties. The company would create maps of urban areas that included outlines of buildings and every detail that might contribute to their fire risk. Those details could include, among other things, the locations of windows, sprinkler systems, and nearby natural resources like rivers, materials used during construction, and nearby fire hydrants.
Here’s an example of a Sanborn map and a map key, courtesy of Clint Tomlinson at the Ohio State University Libraries. Check out that detail! Notice that each building is labeled according to what materia

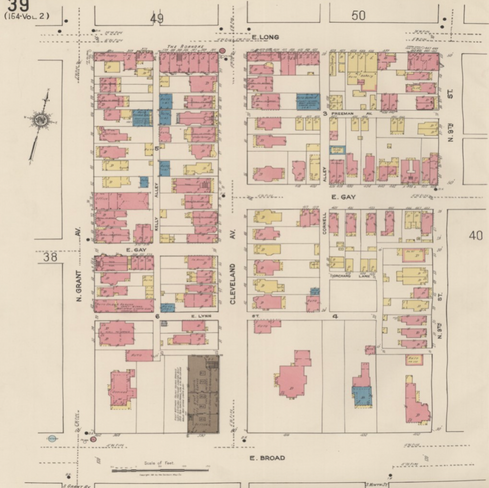


ls it’s made of. You can also see staircases, entrances, how many floors each building has, and more — all important data that might determine how the building might fare in the event of a fire.
As we’re sure you can tell, these maps were incredibly useful at the time they were produced. When you’re thinking about your risk for a fire, it’s helpful to know where the nearest fire hydrant is, right?
But how do we use Sanborn maps in CRM? That answer may seem a little less obvious, but think about it for a minute. These maps hold so much history! When you look at individual buildings, it may seem like Sanborn maps only tell us about the fire liability of buildings from decades ago. But when you look at city blocks, neighborhoods, and whole urban areas and compare their Sanborn maps throughout time, we can track so much data about the development of those areas. When we look at that data alongside data about race, class, political parties, key elections, and more, we can assemble the puzzle of the past and create a clearer picture than ever before.
Let’s look at a case study to learn more about how Sanborn maps help historians understand more about the past. Get ready, because we’re heading down to Louisiana for a visit to a very special playground...
A Sanborn Case Study: The *Name Redacted* Playground
Sanborn maps are pretty different from historic topos, and their uses are a little more specialized. So, to better illustrate their usefulness for you, we thought we’d do a little case study. Welcome to the *Name Redacted* Playground!
(Sorry, we can’t give away the exact location of the site since it’s still a sensitive archaeological area. Suffice it to say, this was a super interesting historic site in New Orleans.)
TerraX recently completed a major project at this particular New Orleans playground site, which is in the middle of a pretty urban area. The fabulous Ms. Margaret Schultz performed the historical research portion of the project, which involved — you guessed it! — Sanborn maps.
Now, as you likely already know, cities are always changing. Street names change, buildings are renumbered, and whole neighborhoods grow and shrink. All kinds of crazy things happen! What’s more, we can’t track those kinds of changes on historic topos — land feature maps, though they sometimes have cities and even some buildings labeled, are much more useful for rural areas than they are for cities. Can you guess what kinds of maps do?
If you guessed Sanborn maps — ding ding ding! You win the prize!
When Margaret was digging through history and trying to put together the story of the *Redacted* Playground, she found herself confused every time the urban area surrounding the site shifted. It was nearly impossible to gather any understanding of who had used the playground — of the community that lived and played there. But when she started digging through old Sanborn maps of the neighborhood, the picture began to come into focus.
Margaret kept track of the address of the playground and the buildings surrounding it and the various numbers and names they used throughout time, and by cross referencing that information with a city directory (basically a big book of people’s names and addresses), she was able to learn the names of the people who lived around the playground reaching all the way back to the turn of the twentieth century.
Suddenly, we had this incredible understanding of the history of the area. We learned that the neighborhood was originally full of German and Irish immigrants and that it later came to be occupied primarily by Black families. She was able to see as family members moved in with each other during the Great Depression, when economic times were tough and relatives shared spaces to cut down on expenses. By gathering data about building numbers and street names, Margaret was able to construct a century’s worth of history for a whole neighborhood and community of people who lived, worked, struggled, and played together through the ups and downs of the twentieth century.
Every Map Is a Treasure Map
Hopefully by now we’ve painted a pretty good picture of how important maps are to our work. We study maps to learn more about the topographic features of our project areas, and we compare maps created at different points in time to see when and how historic features have changed. We also use Sanborn maps — remember, those are old fire insurance maps — to track changing features like buildings and street names to grow our understanding of urban communities.
Every time we look at a new map, we find something new. We gather so much data from the maps we study, and that data is essential to effectively recovering and protecting our cultural resources. In that way, every map is a treasure map.
Thanks for joining us today, Xplorers! Until next time, keep learning!
— The TerraX Team


Comments